Important Notes
a. Please ensure that you clear the browser cache to ensure proper functioning of the changed user interface. Steps to clear browser cache :
- press Ctrl-Shift-Delete (Windows) or Command-Shift-Delete (Mac).
- Select Cookies and other site data and Cached images & files and proceed with clearing the browser cache.
New Features in this Release:
1. Task/Bug Relations
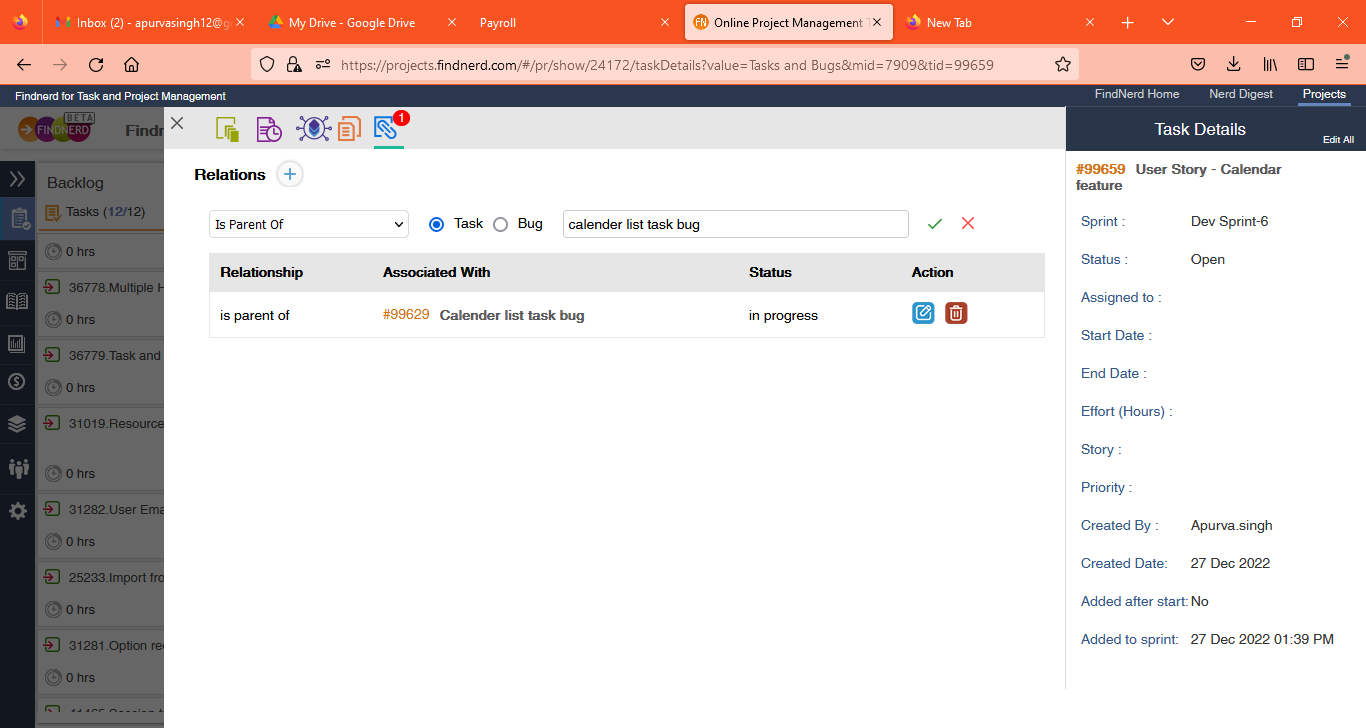
Project users can now add relations to Issues (task & bugs) to link them to other issues allowing the team to track dependencies.
The issues can have the following relationship with other issues within the project
- Is Parent of/is child of
- blocks/is blocked by
- duplicates/is blocked by
Relations for an issue can be added/edited/deleted and viewed on the Task/Bug detail page under the Relations tab as shown below


2. Analytics - Project / Product Burndown Chart
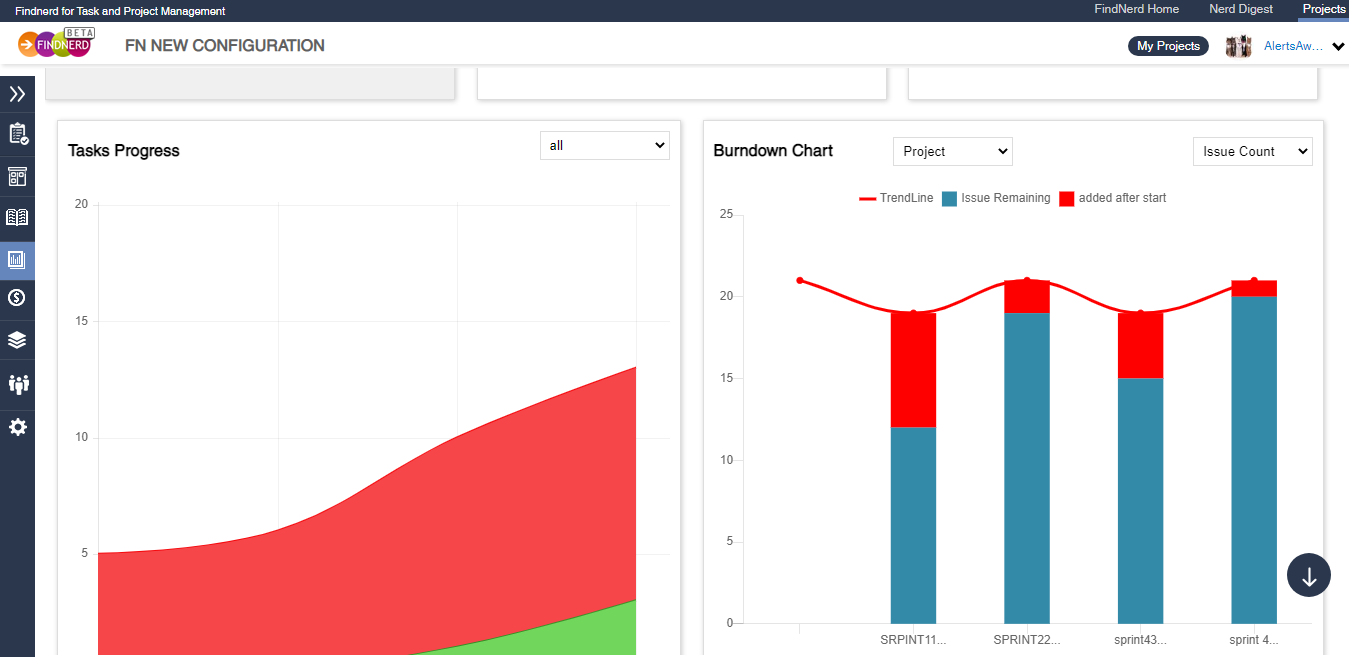
Project Burndown Chart has been added to the Analytics page in addition to the Sprint Burndown chart..
Project Burndown chart allows the Project members to track Project or Product Development progress by graphically displaying the sprint by sprint progress of issues done and work remaining to be completed.

The burndown chart by default displays the Issues Count which remain open (all tasks and bugs) for a given sprint. Alternatively, the user can select Effort in hours which will display the remaining effort for a sprint. In this case the issues which have an estimated effort value will be considered.
For Projects, where the Estimation Unit is configured to be in Story Points, the burndown chart will be based on remaining story points estimated for open Issues.
The start date of the first sprint in the project is considered as the start date of the project. Any issue added after the project start date is shown in red color on top of the ongoing Sprint.
0 Comment(s)