-
Profiler In Unity3D
almost 10 years ago
Hello Readers !!
Hope you are enjoying coding.
Today We are going to discuss about the Profiling in the Unity 3D.
Almost all of us had issue regarding the game performance and memory issues. This is the general issue if you are using the Unity3D.
But you can check your which object is consuming how much memory. What is the part where memory leak is coming.
This can only be done by Unity Profiler. Unity allow you to check the CUP usage, Memory usage, Physics Usage.
You can fin your profiler by following:-
Windos > Profiler
Or
Clt + 7
In this you can check there are multiple sections in which your game is divided.
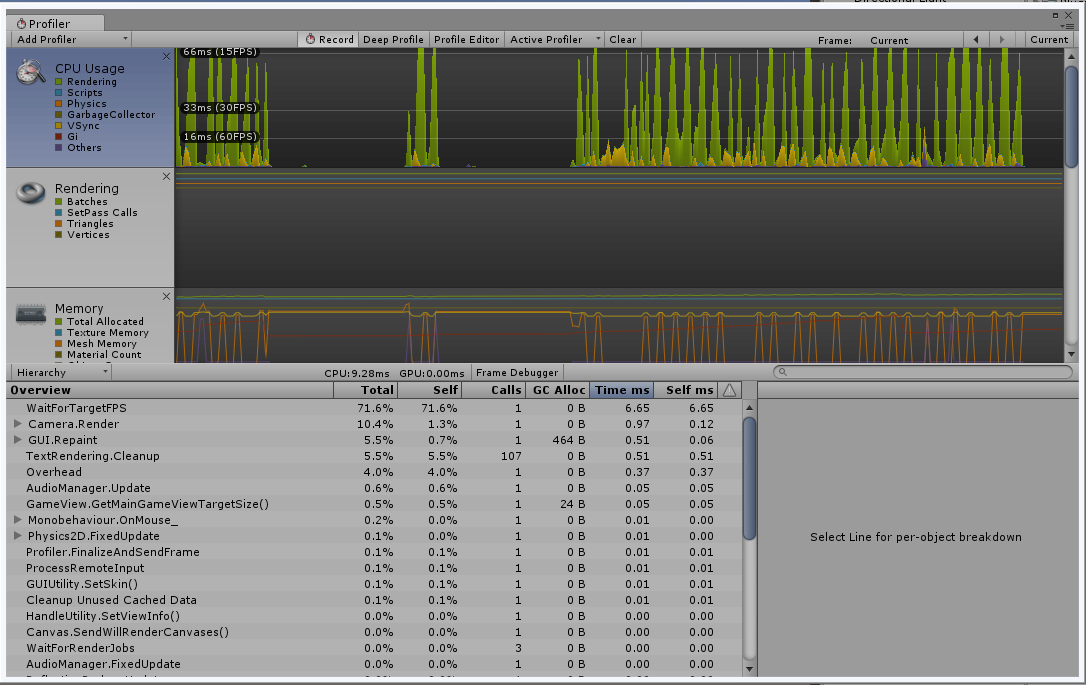
Each of these has a specific property which you check.
You can check following properties of you game in this
- CPU Usage
- Rendering
- Memory
- Audio
- Physics
- Physics (2D)
- Network Messages
- Network Operations.
If you wan to know about the features of all these then stay tuned for my next blog.
Till then keep coding.


0 Comment(s)